Getting Started
- Introduction
- Download
- Installation & Activation
- Troubleshooting
- Data Refresh/Updates
- Software Updates
- Manage Your Subscription
- Example Spreadsheets
General Formulas
Technical Analysis Toolkit
- Introduction
- Simple Moving Average (SMA)
- Exponential Moving Average (EMA)
- Volume Weighted Average Price (VWAP)
- Average True Range (ATR)
- Moving Average Convergence/Divergence (MACD)
- Bollinger Bands
- Relative Strength Index (RSI)
- Aroon
Federal Reserve Economic Data
(FRED)
Yahoo Finance
IG Index / IG Markets
- Account Setup
- Formula Reference
- VBA Functions Reference
- Historical Price Data Download To Excel
- Historical Price Data Download To File
- Historical Client Sentiment Data Download
- Watchlists
- Live Positions, Transactions & Activity History
EODHistoricalData.com
Nasdaq Data Link
IG Index Watchlists
A watchlist is one of the main tools a trader uses to keep track of market movements. IG Index provides several pre-built watchlists covering the main markets such as "Major Indices" and "Major FX".
For example, here is an extract from one of my IG Index watchlists:
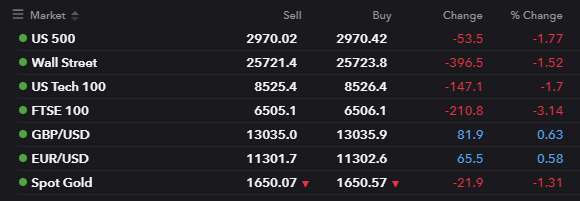
The Excel Price Feed Add-in enables you to download your watchlist data into Excel.
To get started launch the Configuration Pane and select the IG Index->Watchlists tab:
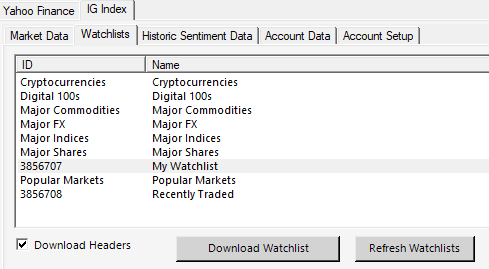
Press the "Refresh Watchlists" button and you will see a list of the built-in IG watchlists as well as any custom ones you have created.
To download a watchlist into your spreadsheet:
- Select the cell where you would like the data to be downloaded to
- Select whether you want to include the column headers or not
- Select the watchlist from the list
- Press the "Download Watchlist" button and the watchlist will be downloaded into your spreadsheet
Once the watchlist data is in Excel you can use all the features of Excel to customise it, link it to other formulas etc.
For example, here I have used a Data Bar in the "% Change" column to visualise the percentage change to show how the markets have moved comparatively:
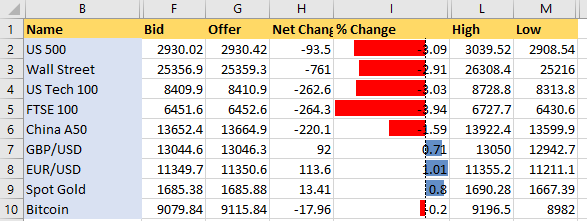
When you wish to update the prices in your watchlist, simply press the "Download Watchlist" button again. You could also use the Excel Price Feed IG Index Formulas to stream live prices to the cells in your watchlist.
IG Index Watchlist Excel Formulas
There are also two Excel formulas which can be used to retrieve the list of watchlists and the contents of a watchlist. These formulas can be used from either VBA or in a cell as an array formula:
EPF.IG.Watchlists
This formula downloads details of all the watchlists available to you:
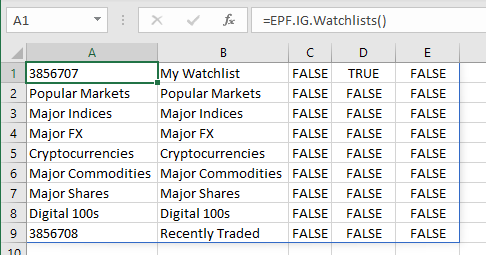
The columns returned are:
- Watchlist ID
- Default System Watchlist (True/False)
- Editable (True/False)
- Deletable (True/False)
EPF.IG.Watchlist
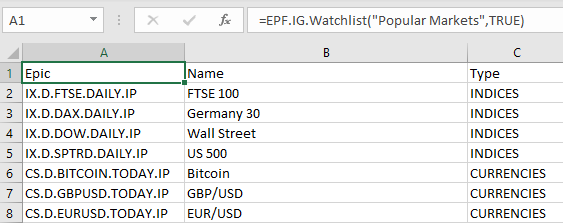
Once you have the watchlist ID you can use this formula to retrieve the contents of the watchlist. This formula takes two parameters, the first is the watchlist ID and the second indicates whether you want to display columns headers or not.
For example, here I am using the formula to retrieve the "Popular Markets" watchlist:
Using the Watchlist formulas in VBA
To use these formulas in your VBA code you can call them using the "Application.Run" command. For example:
                Dim returnValue As Variant

                returnValue = Application.Run("EPF.IG.Watchlist", "Popular Markets", True)
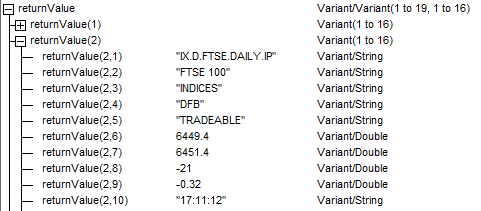
This will return the "Popular Markets" watchlist as a variant array:
