Building an ESG Stock Portfolio in Excel
Introduction
Interest in ethical and sustainable issues has exploded over recent years and today we can see these issues start to influence those in the financial investment community. Investors are increasingly taking into account non-financial factors in their portfolio selection, including a how a company has an impact on the environment and society.
In this tutorial we will walk through building an ESG focused stock portfolio using Excel Price Feed formulas.
Building the portfolio
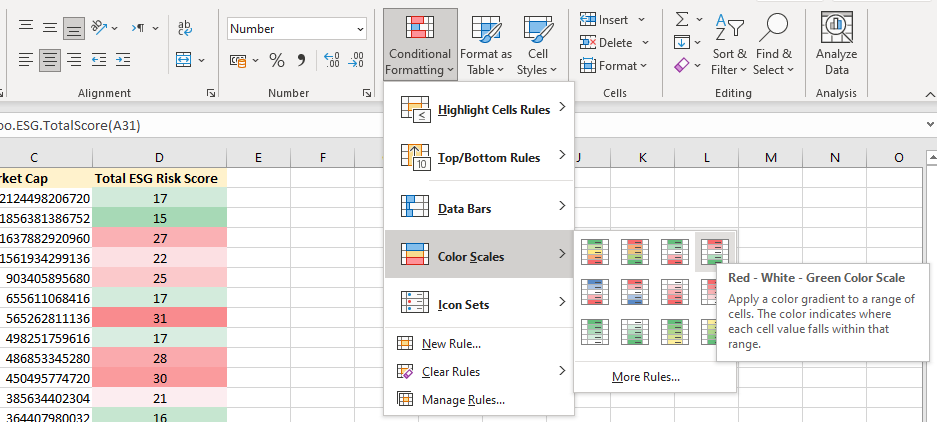
Our starting point is the S&P500, although for this tutorial we will just consider the 30 largest companies in the S&P500. We want to rank these companies based on their ESG ratings and for this we can use the ESG Excel formulas.
The main formula we will use is the formula for providing the ESG Total Risk Score:
EPF.Yahoo.ESG.TotalScore
The Excel Price Feed Add-in can help you build and maintain an investment portfolio spreadsheet with live financial data. The Add-in includes 100+ new Excel formulas for live, historical and fundamental market data.
In this example, I am holding a variety of international stocks, denominated in various currencies across several brokers. In addition I hold some US mutual funds:
The white cells are the only cells which require any information to be manually entered; the grey cells are autocalculated by Excel and the yellow cells are where live data is provided by the Excel Price Feed Add-in.
As you can see only 4 types of data are required for each investment: ticker, broker, quantity and purchase price.

Data such as current price and PE ratio are provided by the Add-in, for example here is the PE ratio formula (which references the Ticker column):


Excel Price Feed Formulas
If you view the formulas in the yellow cells you will see they all are in the format =EPF.Yahoo which indicates the formula is an Excel Price Feed formula connected to Yahoo Finance.
Excel Price Feed formulas usually reference a stock/fund ticker which in this example is in the first column.
If you don't know the ticker you can use the search box on the Configuration Pane (accessed from the button on the toolbar)
As the column is in an Excel table we can reference it by the name @ticker. For example the formula behind the Name column is:
=EPF.Yahoo.Name([@Ticker])
Currency Conversions
The Value column shows the current value of the holding denominated in US Dollars, even though several of the holdings are denominated in other currencies. For example, Samsung Electronics is a South Korean stock denominated in Korean Won.
There is a hidden column, I, which contains the latest USD exchange rate, in this case the KRWUSD exchange rate. The formula in this column is:
=EPF.Yahoo.Price([@Currency]&"USD=X")
As you can see it references the Currency column to generate the currency pair "KRWUSD" which is then passed into the Excel Price Feed live price formula (as Yahoo instrument code KRWUSD=X) to retrieve the latest exchange rate.
This FX rate value is referenced by the formula in the Value column which results in the value being converted to USD:
=([@Current]*[@Quantity])*[@FX]
And the result is a live FX rate and value in USD:

Data Refresh
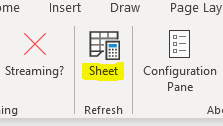
Any time you wish to revalue the portfolio based on live prices, simply press the "Refresh Sheet" button on the Excel Price Feed toolbar:

Summary
We hope this tutorial has provided some useful guidance on using Excel Price Feed to build a "live" investment portfolio in Excel.
Discover the power of Excel Price Feed with 80+ new Excel formulas for live, historic and fundamental data in your spreadsheet. Click the button below to request an Activation Code for your free 10 day trial: