Technical Indicators: Moving Average Convergence Divergence (MACD)
The Moving Average Convergence Divergence (MACD) indicator is a simple oscillator view of two converging / diverging exponential moving averages and their differences.
It is a popular trend-following momentum indicator used to assess the strength and direction of a market's price movement. It can help identify potential buy and sell signals, as well as gauge the overall momentum of a market.
Historical Price Requirements
You must provide at least (2×(slowPeriods + signalPeriods)) or (slowPeriods + signalPeriods + 100) worth of quotes, whichever is more, to cover the warmup and convergence periods.
Since MACD uses a smoothing technique, we recommend you use at least (slowPeriods + signalPeriods + 250) data points prior to the intended analysis date for more precise values.
Excel Formula Details
The Excel formula for calculating the MACD is:
=EPF.TA.MACD(prices, dates, fastPeriods, slowPeriods, signalPeriods)
The input parameters required are:
| Parameter | Description |
|---|---|
| Prices | An Excel range of the prices. |
| Dates | An Excel range of the dates. |
| Fast Periods | The number of periods for the faster moving average. Must be greater than 0. |
| Slow Periods | The number of periods for the slower moving average. Must be greater than "Fast Periods". |
| Signal Periods | The number of periods for the moving average of MACD. Must be greater than or equal to 0. |
The range of prices and dates must correspond and be of the same length, for example the first date in the date range must correspond to the first price in the price range.
The output columns are:
| Output Column | Description |
|---|---|
| Date | The date that the MACD corresponds to. |
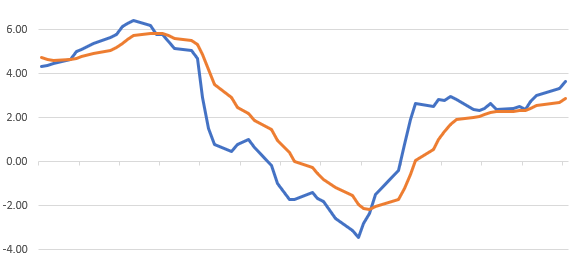
| MACD | The MACD is the difference between the slow and fast moving averages (MACD = FastEMA - SlowEMA). |
| Signal | Moving average of the MACD. |
| Histogram | The gap between the MACD and Signal. |
| FastEMA | The Fast Exponential Moving Average. |
| SlowEMA | The Slow Exponential Moving Average. |
Example Excel Formula
"Calculate the MACD with 12 fast periods, 26 slow periods and 9 signal periods"
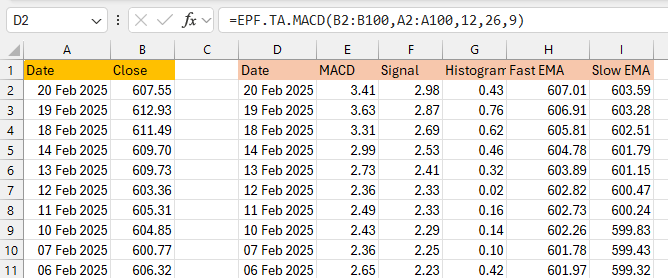
In this example you can see the price/date data in columns A and B respectively. The MACD formula is in cell D2 and references the price (A2:A502) and date (B2:B502) ranges as well as the 3 MACD parameters:
=EPF.TA.MACD(B2:B502,A2:A502,12,26,9)
The formula calculates the MACD, Signal, Histogram, Fast EMA and Slow EMA: