Getting Started
- Introduction
- Download
- Installation & Activation
- Troubleshooting
- Data Refresh/Updates
- Software Updates
- Manage Your Subscription
- Example Spreadsheets
General Formulas
Technical Analysis Toolkit
- Introduction
- Simple Moving Average (SMA)
- Exponential Moving Average (EMA)
- Volume Weighted Average Price (VWAP)
- Average True Range (ATR)
- Moving Average Convergence/Divergence (MACD)
- Bollinger Bands
- Relative Strength Index (RSI)
- Aroon
Federal Reserve Economic Data
(FRED)
Yahoo Finance
IG Index / IG Markets
- Account Setup
- Formula Reference
- VBA Functions Reference
- Historical Price Data Download To Excel
- Historical Price Data Download To File
- Historical Client Sentiment Data Download
- Watchlists
- Live Positions, Transactions & Activity History
EODHistoricalData.com
Nasdaq Data Link
Yahoo Finance Historical Array Formulas
The Add-in provides several formulas for historical financial data which are designed to be used as "Array Formulas".
Historical data available includes prices and dividends.
This page describes these array formulas provided by the Add-in followed by a Walkthrough of how to use them:
- What is an array formula?
- EPF.Yahoo.HistoricIntraday
- EPF.Yahoo.Historic1MinuteLookback
- EPF.Yahoo.Historic5MinuteLookback
- EPF.Yahoo.Historic1HourLookback
- EPF.Yahoo.HistoricDailyLookback
- EPF.Yahoo.HistoricDailyLookbackClose
- EPF.Yahoo.HistoricDailyLookbackAdjustedClose
- EPF.Yahoo.HistoricDatePeriod
- EPF.Yahoo.HistoricDailyWeeklyMonthly
- EPF.Yahoo.DividendsDatePeriod
- Walkthrough: Using the historical daily lookback array formula
What is an array formula?
An array formula is a formula which affects (or populates with data) more than its "own" cell.
The Add-in provides these types of formulas so that you can use a single formula to download a time-series of historical data. These formulas are great for providing data for backtesting trading ideas or historical data analysis.
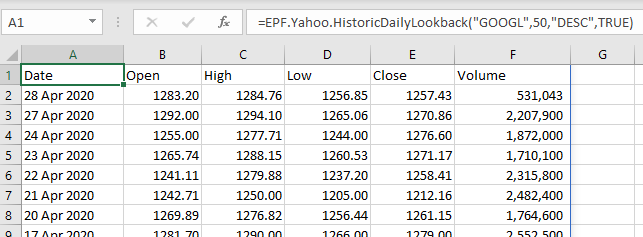
For example, here is a 50 day historical time series (open, high, low, close and volume) for Google stock using just one Excel formula:
=EPF.Yahoo.HistoricDailyLookback("GOOGL",50,"DESC",1)
Unless you are using Office 365 (see box below) they differ from standard formulas in two ways:
- They require you to highlight the cells which the formula will populate.
- They require a special key combination (CTRL-SHIFT-ENTER) to be used after entering the formula.
They are also referred to as "Ctrl-Shift-Enter" or "CSE" formulas, because you always need to press Ctrl+Shift+Enter to enter them.
The Excel Price Feed Add-in currently provides 7 dynamic array formulas:
EPF.Yahoo.HistoricIntraday
This formula populates your spreadsheet with historical intraday data for a single day:
=EPF.Yahoo.HistoricIntraday(ticker, resolution, date, includePrePost, order, includeHeaders)
The input parameters required are:
| Parameter | Optional | Description |
|---|---|---|
| Ticker | No | The ticker for the instrument, eg "APPL" or "SPY" |
| Resolution | No | Must be an intraday resolution, so one of: 1 min, 2 min, 5 min, 15 min, 30 min or 1 hour |
| Date | No | The date for the intraday data request |
| IncludePrePost | Yes | Whether to include pre and post market prices in the returned dataset |
| Order | Yes | The order that the data will be displayed, either "DESC" for Descending (latest first) or "ASC" for Ascending (oldest first). |
| Include Headers | Yes | Whether to display column headers for the data, either 1 to show or 0 to hide. |
The output columns are:
| Output Column | Description |
|---|---|
| Date | The date/time of the price sample. |
| Open | The open price of the period/bar. |
| High | The high price of the period/bar. |
| Low | The low price of the period/bar. |
| Close | The close price of the period/bar. |
| Volume | The volume of stock traded during the period/bar. |
Example
We would like to populate our spreadsheet with intraday 1 minute Nasdaq data for the current trading day. We insert the following formula into cell B1:
=EPF.Yahoo.HistoricIntraday("^IXIC","1 Min",TODAY(),0,"DESC",1)
Where "^IXIC" is the Nasdaq ticker; "1 Min"" is for 1 minute resolution/bars; TODAY() is the formula for todays date; 0 as we don't want pre or post market data'; "DESC" as we want the data descending, so latest first; 1 as we want to display the column headings.
This will output the following to Excel:
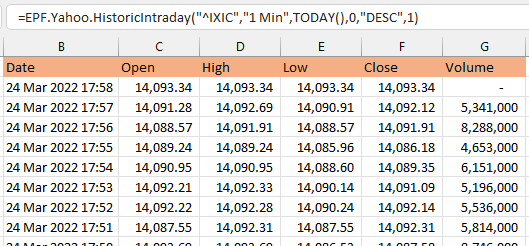
Each time the spreadsheet is refreshed the latest 1 minute data bar is downloaded to the sheet.
EPF.Yahoo.Historic1MinuteLookback
EPF.Yahoo.Historic5MinuteLookback
EPF.Yahoo.Historic1HourLookback
These 3 formulas will populate your spreadsheet with historic intraday data for the specified lookback period.
All 3 formulas have the same parameters and retun data in the same format:
=EPF.Yahoo.Historic1MinuteLookback(ticker, daysBack, order, includeHeaders, includePrePost)
The input parameters are:
| Parameter | Description |
|---|---|
| Ticker | The ticker for the instrument, eg "NVDA" or "XOM" |
| Periods Back | The number of periods (1 minute, 5 minute or 1 hour) the formula will retrieve i.e. the lookback which is back from now. |
| Order | The order that the data will be displayed, either "DESC" for Descending (latest first) or "ASC" for Ascending (oldest first). |
| Include Headers | Whether to display column headers for the data, either 1 to show or 0 to hide. |
| IncludePrePost | Whether to include pre and post market prices in the returned dataset [optional] |
The output columns are:
| Output Column | Description |
|---|---|
| Date | The date/time of the price sample. |
| Open | The open price of the period. |
| High | The high price of the period. |
| Low | The low price of the period. |
| Close | The close price of the period. |
| Volume | The volume of stock traded for the period. |
EPF.Yahoo.HistoricDailyLookback
This formula populates your spreadsheet with historic daily data for the specified number of days back from today:
=EPF.Yahoo.HistoricDailyLookback(ticker, daysBack, order, includeHeaders)
The input parameters required are:
| Parameter | Description |
|---|---|
| Ticker | The ticker for the instrument, eg "APPL" or "SPY" |
| Days Back | The number of days data the formula will retrieve (back from today). |
| Order | The order that the data will be displayed, either "DESC" for Descending (latest first) or "ASC" for Ascending (oldest first). |
| Include Headers | Whether to display column headers for the data, either 1 to show or 0 to hide. |
The output columns are:
| Output Column | Description |
|---|---|
| Date | The date of the price sample. |
| Open | The open price of the day. |
| High | The high price of the day. |
| Low | The low price of the day. |
| Close | The close price of the day. |
| Volume | The volume of stock traded for the day. |
Example
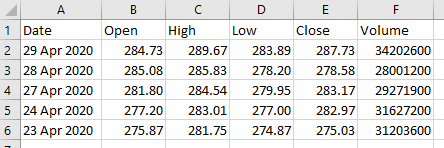
We would like to populate our spreadsheet with the last 5 trading days of historical data for Apple stock. We insert the following formula into cell A1:
=EPF.Yahoo.HistoricDailyLookback("AAPL",5,"DESC",1)
Where "AAPL" is for Apple Stock; 5 is for the number of days back; "DESC" as we want the data descending, so latest first; 1 as we want to display the column headings.
This will output the following to Excel:
EPF.Yahoo.HistoricDailyLookbackClose
This formula populates your spreadsheet with historic daily close prices for the specified number of days back from today:
=EPF.Yahoo.HistoricDailyLookbackClose(ticker, daysBack, order , includeHeaders)
The input parameters required are:
| Parameter | Description |
|---|---|
| Ticker | The ticker for the instrument, eg "APPL" or "SPY" |
| Days Back | The number of days data the formula will retrieve (back from today). |
| Order | The order that the data will be displayed, either "DESC" for Descending (latest first) or "ASC" for Ascending (oldest first). |
| Include Headers | Whether to display column headers for the data, either 1 to show or 0 to hide. |
The output columns are:
| Output Column | Description |
|---|---|
| Date | The date of the price sample. |
| Close | The close price of the day. |
Example
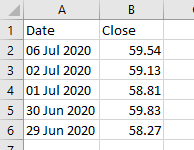
We would like to populate our spreadsheet with the last 5 trading days close prices for Intel stock. We insert the following formula into cell A1:
=EPF.Yahoo.HistoricDailyLookbackClose("INTC",5,"DESC",1)
Where "INTC" is for Intel Stock; 5 is for the number of days back; "DESC" as we want the data descending, so latest first; 1 as we want to display the column headings.
This will output the following to Excel:
EPF.Yahoo.HistoricDailyLookbackAdjustedClose
This formula populates your spreadsheet with historic daily adjusted close prices for the specified number of days back from today:
=EPF.Yahoo.HistoricDailyLookbackAdjustedClose(ticker, daysBack, order , includeHeaders)
The input parameters required are:
| Parameter | Description |
|---|---|
| Ticker | The ticker for the instrument, eg "APPL" or "SPY" |
| Days Back | The number of days data the formula will retrieve (back from today). |
| Order | The order that the data will be displayed, either "DESC" for Descending (latest first) or "ASC" for Ascending (oldest first). |
| Include Headers | Whether to display column headers for the data, either 1 to show or 0 to hide. |
The output columns are:
| Output Column | Description |
|---|---|
| Date | The date of the price sample. |
| Adj. Close | The adjusted close price of the day. |
EPF.Yahoo.HistoricDateRange
DEPRECATED: please use EPF.Yahoo.HistoricDatePeriod below as this formula allows you to specify a sort order and optional column headings.
EPF.Yahoo.HistoricDatePeriod
This formula populates your spreadsheet with historical price data for a specified resolution and date period.
All times are Coordinated Universal Time (UTC).
To convert to local time you can use the EPF.Dates.UTCToLocal formula.
Some Examples, with no daylight saving adjustments:
- US: New York is UTC-4 therefore 13:00 UTC is 09:00 New York time.
- Paris/Frankfurt UTC+2 therefore 13:00 UTC is 15:00 Paris/Frankfurt time.
- Hong Kong/Singapore: UTC+8 therefore 08:00 UTC is 16:00 Hong Kong/Singapore time.
- UK: London is UTC+1 therefore 13:00 UTC is 14:00 London time.
- Brazil: Sao Paulo is UTC-3 therefore 13:00 UTC is 10:00 Sao Paulo time.
The input parameters required are:
| Parameter | Description |
|---|---|
| Ticker | The ticker for the instrument, eg "APPL" or "SPY" |
| Resolution | This can be one of: "1 Minute", "2 Minute", "5 Minute", "15 Minute", "30 Minute", "1 Hour", "Daily", "Weekly", "Monthly" |
| Start Date | The start date of the data the formula will retrieve. |
| End Date | The end date of the data the formula will retrieve. |
| Order | The order that the data will be displayed, either "DESC" for Descending (latest first) or "ASC" for Ascending (oldest first). |
| Include Headers | Whether to display column headers for the data, either 1 to show or 0 to hide. |
The output columns are:
| Output Column | Description |
|---|---|
| Date / Time | The date / time of the price sample. |
| Open | The open price of the period. |
| High | The high price of the period. |
| Low | The low price of the period. |
| Close | The close price of the period. |
| Volume | The volume of stock traded during the period. |
Example 1
We would like to populate our spreadsheet with weekly historical data for Apple stock for January 2020. We insert the following formula into cell A1:
=EPF.Yahoo.HistoricDatePeriod("AAPL","Weekly","1 Jan 2020","29 Jan 2020", "ASC", 0)
Where "AAPL" is for Apple Stock; "Weekly" is for the resolution; "1 Jan 2020" is the start date; "29 Jan 2020" is the end date
This will output the following to Excel:

Example 2
You can also combine this formula with Excels built-in date functions to create a "rolling" period/window, so each time you refresh the sheet the period/window is rolled forward.
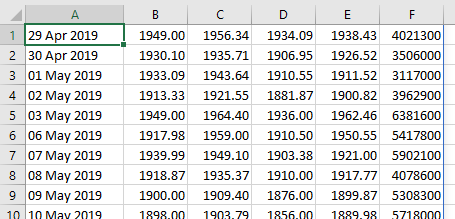
For example here, for Amazon daily data, we are using the EDATE and the TODAY() functions to dynamically specify the start and end dates. This provides a 12 month rolling window:
=EPF.Yahoo.HistoricDatePeriod("AMZN","Daily", EDATE(TODAY(),-12),TODAY(), "ASC", 0)
This will output the following to Excel:
EPF.Yahoo.HistoricDailyWeeklyMonthly
This formula populates your spreadsheet with historic daily/weekly/monthly data for a specified date range.
The input parameters required are:
| Parameter | Description |
|---|---|
| Ticker | The ticker for the instrument, eg "APPL" or "SPY" |
| Start Date | The start date of the data the formula will retrieve. |
| End Date | The end date of the data the formula will retrieve. |
| Order | The order that the data will be displayed, either "DESC" for Descending (latest first) or "ASC" for Ascending (oldest first). |
| Include Headers | Whether to display column headers for the data, either 1 to show or 0 to hide. |
The output columns are:
| Output Column | Description |
|---|---|
| Symbol | The symbol/ticker of the stock. |
| Date | The date of the price sample. |
| Day Open | The daily open price. |
| Day High | The daily high price. |
| Day Low | The daily low price. |
| Day Close | The daily close price. |
| Day Adjusted Close | The daily adjusted close price. |
| Day Volume | The daily volume of stock traded. |
| Week Open | The weekly open price. |
| Week High | The weekly high price. |
| Week Low | The weekly low price. |
| Week Close | The weekly close price. |
| Week Adjusted Close | The weekly adjusted close price. |
| Week Volume | The weekly volume of stock traded. |
| Month Open | The monthly open price. |
| Month High | The monthly high price. |
| Month Low | The monthly low price. |
| Month Close | The monthly close price. |
| Month Adjusted Close | The monthly adjusted close price. |
| Month Volume | The monthly volume of stock traded. |
Example
=EPF.Yahoo.HistoricDailyWeeklyMonthly("AAPL","1 Oct 2019","15 Nov 2019", "DESC", 1)
Where "AAPL" is for Apple Stock; "1 Oct 2019" is the start date; "15 Nov 2019" is the end date; "DESC" as we want the data descending, so latest first; 1 as we want to display the column headings
This will output the following to Excel:


EPF.Yahoo.DividendsDatePeriod
This formula populates your spreadsheet with historical dividend data for the specified date period:
=EPF.Yahoo.DividendsDatePeriod(ticker, startDate, endDate, order, includeHeaders)
The input parameters required are:
| Parameter | Description |
|---|---|
| Ticker | The ticker for the instrument, eg "APPL" or "MSFT" |
| Start Date | The start date of the dividend data the formula will retrieve. |
| End Date | The end date of the dividend data the formula will retrieve. |
| Order | The order that the data will be displayed, either "DESC" for Descending (latest dividends first) or "ASC" for Ascending (oldest dividends first). |
| Include Headers | Whether to display column headers for the data, either 1 to show or 0 to hide. |
The output columns are:
| Output Column | Description |
|---|---|
| Date | The dividend date. |
| Dividend | The dividend amount. |
Example
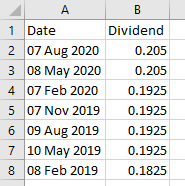
We would like to populate our spreadsheet with the dividends paid by Apple since Jan 1 2019. We insert the following formula into cell A1:
=EPF.Yahoo.DividendsDatePeriod("AAPL","1 Jan 2019",NOW(),"DESC",1)
Where "AAPL" is for Apple Stock; "1 Jan 2019" is the start date; NOW() is the end date, i.e. today; "DESC" as we want the data descending, so latest first; 1 as we want to display the column headings.
This will output the following to Excel:
Walkthrough: Using the historical daily lookback array formula
All of the Array Formulas are used in a similar way, this walkthrough will show how to use the EPF.Yahoo.HistoricDailyLookback formula (for non Office 365 users).
1. Highlight the output range in your spreadsheet
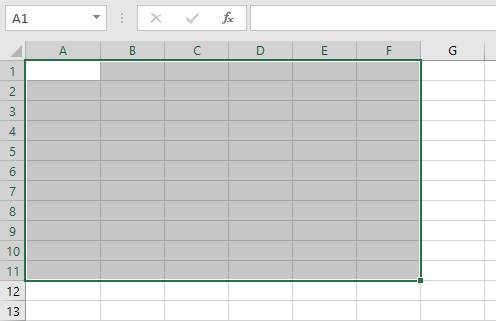
Select the range of the cells where you would like the results of the formula to be displayed. The formula returns 6 columns: Date, Open, High, Low, Close, Volume (OHLC-V).
For this example we will request the previous 10 days OHLC-V daily data for Apple stock. We want to display the column headings, therefore we need to highlight a range of 11 rows by 6 columns as shown below:
2. Enter the array formula
We will now enter the array formula into cell A1, as this is the top left corner of our selected range.
The formula we enter is: =EPF.Yahoo.HistoricDailyLookback("AAPL",10,"DESC",1)
"AAPL" for Apple Stock; 10 for the number of days back; "DESC" as we want the data descending, so latest first; 1 as we want to display the column headings
3. Apply the array formula to the highlighted range
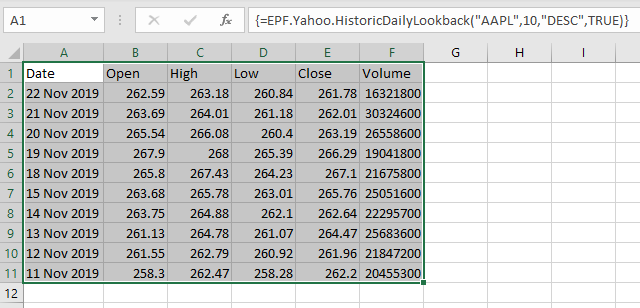
Once we have entered the formula we press "Ctrl-Shift-Enter" (all 3 keys at the same time) to action the formula and retrieve the data.
The sheet is then populated with the data as shown below:
4. Refreshing the data
The real power of this array formula is that it will always retrieve the latest data when we refresh the spreadsheet. So, the next trading day I can refresh the sheet and the oldest day will drop off to be replaced by the latest day, the sheet will always contain the last 10 trading days worth of data!