Federal Reserve Economic Data (FRED) - Overview & Setup
Federal Reserve Economic Data (FRED) is a economic data database maintained by the Federal Reserve Bank of St. Louis. It contains 824,000 US and international time series from 114 data sources.
Datasets include all of the major market moving economic statistics such as Inflation (CPI), Gross Domestic Product (GDP), Industrial Production, Initial Claims, Unemployment and Nonfarm Payrolls.
Finding Datasets
The easiest way to find a dataset is to use the "Search" box on the FRED tab. Press the "Configuration Pane" button on the ExcelPriceFeed tab in Excel and then select the FRED tab.
Here you can enter a search term, for example "US CPI":
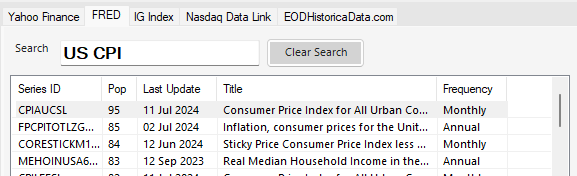
The result list shows all the datasets containing the search term, ordered by popularity (column "Pop") - so the most popular datasets are shown at the top.
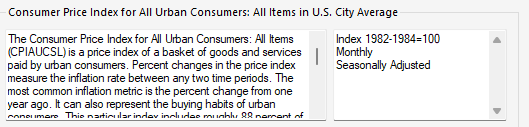
Select a dataset and the name and description will be shown below.
Understanding FRED data
The datasets available via FRED are generally lists of date and value pairs. The type of data is dependent on the dataset.
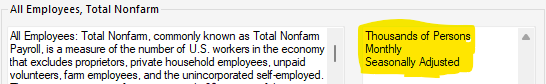
For example if we look at US non-farm payrolls, which is a measure of the current number of employees in the US economy, we can see that for this dataset:
- Units are "Thousands of persons"
- Frequency is Monthly
- The data is seasonally adjusted
Understanding the Excel Price Feed FRED formulas
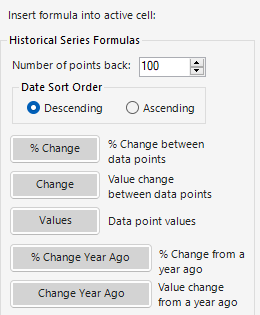
Once you have found a dataset, you can use the formula buttons to insert a formula into your spreadsheet.
There are two types of formulas: historical formulas which return a time series of points and single point formulas.
Historical Time Series Formulas
We'll start by looking at the historical time series formulas:
In the spreadsheet below we have inserted the various FRED historical formulas to demonstrate how they work, referencing the US non-farm payroll dataset (all values are in 1000s of persons):
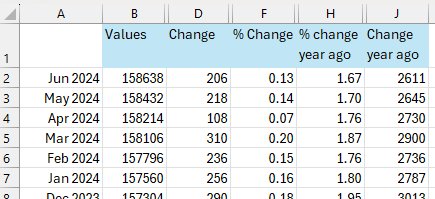
We can see that for June 2024, total non-farm payrolls were 158,638,000 which was a change of 206,000 on the previous month, or a 0.13% month on month increase.
The annual increase, since June 2023, was 2,611,000 or 1.67%
Looking at each column, we can see which formula is used:
- Date Period (Column A): Frequency is monthly. This always the first column of all the time series formulas.
- Values (B): These are the actual values for each month, using the
EPF.FRED.HistoricLookbackformula - Change (C): This is the change each month (from one month to the next) using the
FRED.HistoricLookback.Changeformula - % Change (F): This is the % change each month (from one month to the next) using the
FRED.HistoricLookback.PercentChangeformula - % Change Year Ago (H): This is the % change from a year ago, so row 2 shows the % change from Jun 2023 to June 2024, using the
FRED.HistoricLookback.PercentChange.YearAgoformula - Change Year Ago (J): This is the actual (value) change from a year ago, using the
FRED.HistoricLookback.Change.YearAgoformula
Single Data Point Formulas
Excel Price Feed also includes a set of formulas to return a single FRED datapoint:
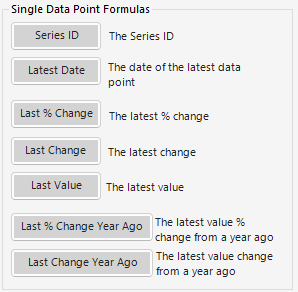
In the spreadsheet below we have inserted the various FRED single data point formulas, again referencing the US non-farm payroll dataset:
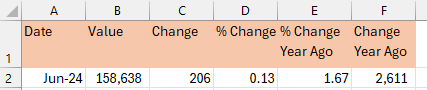
Looking at each column, we can see which formula is used:
- Date Period (Column A):The latest FRED date for the series using the
=EPF.FRED.LatestDateformula - Value (B): This is the actual value for the latest month, using the
EPF.FRED.Lastformula - Change (C): This is the change from the previous month using the
FRED.Last.Changeformula - % Change (F): This is the % change from the previous month using the
FRED.Last.PercentChangeformula - % Change Year Ago (H): This is the % change from a year ago using the
FRED.Last.PercentChange.YearAgoformula - Change Year Ago (J): This is the actual (value) change from a year ago, using the
FRED.Last.Change.YearAgoformula