Technical Indicators: Relative Strength Index (RSI)
The Relative Strength Index (RSI) is a momentum oscillator that measures the speed and change of price movements.
It was developed by J. Welles Wilder and is commonly used in technical analysis to assess whether a stock or asset is overbought or oversold.
- RSI oscillates between 0 and 100.
- Levels above 70 typically indicate that an asset is overbought, meaning it might be due for a pullback or correction.
- Levels below 30 suggest that the asset is oversold, meaning it could be undervalued and may see a rebound.
- RSI is usually calculated over a 14-period lookback window.
The Excel formula for calculating the Relative Strength Index is:
=EPF.TA.RSI(prices, dates, lookbackWindow)
The input parameters required are:
| Parameter | Description |
|---|---|
| Prices | An Excel range of the prices. |
| Dates | An Excel range of the dates. |
| Lookback Window | The number of periods in the lookback window. |
The range of prices and dates must correspond and be of the same length, for example the first date in the date range must correspond to the first price in the price range.
The output columns are:
| Output Column | Description |
|---|---|
| Date | The date that the Relative Strength Index corresponds to. |
| RSI | The Relative Strength Index. |
Example
"Calculate the RSI with a 14 day lookback window"
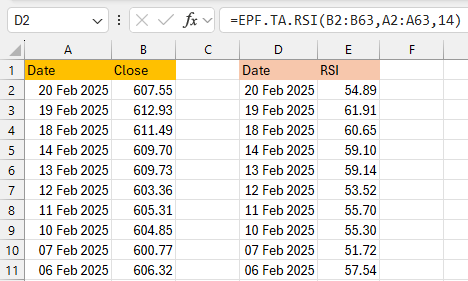
In this example you can see the date/price data in columns A and B respectively. The RSI formula is in cell D2 and references the price (B2:B63) and date (A2:A63) ranges as well as the 14 day lookback:
=EPF.TA.RSI(B2:B63,A2:A63,14)
The formula calculates the RSI and returns the corresponding dates and RSI to columns D and E respectively: