Getting Started
- Introduction
- Download
- Installation & Activation
- Troubleshooting
- Data Refresh/Updates
- Software Updates
- Manage Your Subscription
- Example Spreadsheets
General Formulas
Technical Analysis Toolkit
- Introduction
- Simple Moving Average (SMA)
- Exponential Moving Average (EMA)
- Volume Weighted Average Price (VWAP)
- Average True Range (ATR)
- Moving Average Convergence/Divergence (MACD)
- Bollinger Bands
- Relative Strength Index (RSI)
- Aroon
Federal Reserve Economic Data
(FRED)
Yahoo Finance
IG Index / IG Markets
- Account Setup
- Formula Reference
- VBA Functions Reference
- Historical Price Data Download To Excel
- Historical Price Data Download To File
- Historical Client Sentiment Data Download
- Watchlists
- Live Positions, Transactions & Activity History
EODHistoricalData.com
Nasdaq Data Link
Federal Reserve Economic Data (FRED) - Formula Reference
There are two types of FRED formulas: historical formulas which return a time series of points and single point formulas:
Historical Time Series Formulas
The FRED historical time series formulas return a series of dates and values.
These formulas are standard Excel array formulas and return a series of dates (optional) and values. The data type of the value depends on the formula used, some are actual values, others are changes or percentage changes.
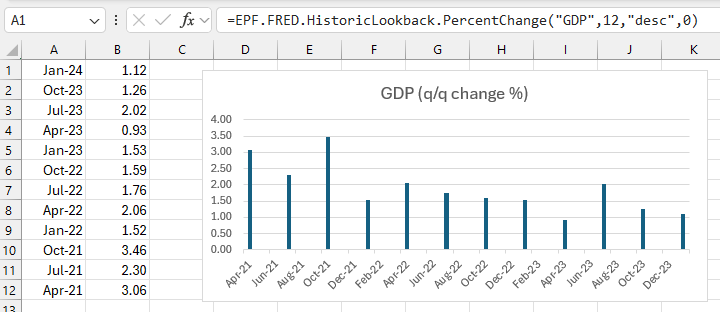
Here is the formula for returning the quarterly change in US GDP, and from this single formula you can easily create a dynamic chart:

All of the historical time series formulas use the same parameters.
For example, here is the formula to return the values of a FRED time series:
=EPF.FRED.HistoricLookback(seriesID, requestedNumPoints, order, hideDateColumn)
The input parameters are:
| Parameter | Optional | Description |
|---|---|---|
| Series ID | No | The FRED Series ID for the data series |
| Requested Number Of Points | No | The number of data points to return |
| Order | Yes | The order that the data will be displayed; either "DESC" for Descending (latest first) or "ASC" for Ascending (oldest first). The default is descending |
| Hide Date Column | Yes | Whether to return the date column or just the values, either 1 to hide or 0 to show. The default is show. |
The output columns are:
| Output Column | Description |
|---|---|
| Date | The date/time of the value (not returned if hide date column is specified) |
| Value | The value |
EPF.FRED.HistoricLookback
This formula populates your spreadsheet with a FRED historical time series of values for the specified series and number of period back from today:
=EPF.FRED.HistoricLookback(seriesID, requestedNumPoints, order, hideDateColumn)
EPF.FRED.HistoricLookback.Change
This formula populates your spreadsheet with a FRED historical time series showing change for the specified series and number of period back from today:
=EPF.FRED.HistoricLookback.Change(seriesID, requestedNumPoints, order, hideDateColumn)
EPF.FRED.HistoricLookback.PercentChange
This formula populates your spreadsheet with a FRED historical time series showing percent change for the specified series and number of period back from today:
=EPF.FRED.HistoricLookback.PercentChange(seriesID, requestedNumPoints, order, hideDateColumn)
EPF.FRED.HistoricLookback.Change.YearAgo
This formula populates your spreadsheet with a FRED historical time series showing change from a year ago for the specified series and number of period back from today:
=EPF.FRED.HistoricLookback.Change.YearAgo(seriesID, requestedNumPoints, order, hideDateColumn)
EPF.FRED.HistoricLookback.PercentChange.YearAgo
This formula populates your spreadsheet with a FRED historical time series showing percent change from a year ago for the specified series and number of period back from today:
=EPF.FRED.HistoricLookback.PercentChange.YearAgo(seriesID, requestedNumPoints, order, hideDateColumn)
Single Data Point Formulas
These formulas just look at the latest data point for the specified FRED series.
They all require just one parameter, the FRED data seried ID, and they all just return one value.
EPF.FRED.LatestDate
This formula populates your spreadsheet with the latest FRED date for the specified series:
=EPF.FRED.LatestDate(seriesID)
EPF.FRED.Last
This formula populates your spreadsheet with the latest FRED value for the specified series:
=EPF.FRED.Last(seriesID)
EPF.FRED.Last.Change
This formula populates your spreadsheet with the latest FRED change for the specified series:
=EPF.FRED.Last.Change(seriesID)
EPF.FRED.Last.PercentChange
This formula populates your spreadsheet with the latest FRED % change for the specified series:
=EPF.FRED.Last.PercentChange(seriesID)
EPF.FRED.Last.Change.YearAgo
This formula populates your spreadsheet with the latest FRED change from a year ago for the specified series:
=EPF.FRED.Last.Change.YearAgo(seriesID)
EPF.FRED.Last.PercentChange.YearAgo
This formula populates your spreadsheet with the latest FRED % change from a year ago for the specified series:
=EPF.FRED.Last.PercentChange.YearAgo(seriesID)