Building A Stock Screener In Excel With Yahoo Finance Data
Introduction
In this tutorial we will build an Excel stock screener to analyse the constituent companies of the S&P 500. We will use the Excel Price Feed Yahoo Finance formulas to automatically populate and update cells with live financial data from Yahoo Finance.
The goal of the screener is to help us to identify trading/investment opportunities from the stocks that are currently in the S&P 500. We would like to explore various filters and criteria, such as market capitalisation, sector etc.
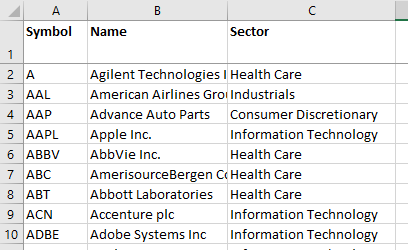
The first step is to download a list of the companies that make up the S&P 500, there are many sources on the web; here we are using a download from datahub.io:

Excel Price Feed Formulas
Now that we have some data to work with, we can start adding Excel Price Feed formulas to the spreadsheet. Excel Price Feed provides a new set of formulas that used to retrieve data from Yahoo Finance, for a complete reference please refer to Formula Reference: Yahoo Finance
Here we can see the formula for retrieving the live price from Yahoo Finance, it requires a reference to the stock ticker which is in column A:
=EPF.Yahoo.Price(A2)

We can continue adding more formulas to the spreadsheet to create a comprehensive set of metrics for each stock:

Visualisations with Excel Data Bars
Once we have the data in Excel we can use the power of Excel formulas and visualisations to really bring the data to life.
For example, if you are looking to see which stocks are near their 52 week high or 52 week low then we can easily create a visualisation in Excel to surface this information. A stock near its 52 week low can perhaps indicate that it is relatively cheap.
A simple formula to achieve this can calculate where the current price is in relation to the 52 week range:
=(current price - 52 week low)/(52 week high - 52 week low)
We can add this formula to column L and then convert this column to an Excel Data Bar so we can quickly see which stocks are near their 52 week low and which are near their 52 week high.
For example, here we can see that AAL (American Airlines) is near its 52 week low whereas ADP (Automatic Data Processing) is pretty much at its 52 week high:

Stock Screening using Excel filters
Once we have all the formulas and data in the spreadsheet we can create an Excel table which will allow us to easily filter and sort the data.
For example, say we are interested in stocks in the health care sector, with a large market capitalisation (>$100bn) and a small Price to Earnings ratio we can setup some Excel table filters to help surface the stocks that meet this criteria. Here are the filters we have applied and the sort order:
- Sector: Health Care
- Market Capitalisation: more than $100bn
- Sort: By Price to Earnings Ratio (PE) smallest>largest
This results in a table that looks like the one below. Here we can see that Amgen Inc. meets our criteria, it also has the lowest PE ratio and is approximately in the middle of its 52 week range:

Data Refresh
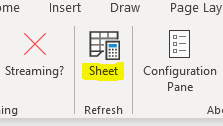
Any time you wish to update the stock screener with live data, simply press the "Refresh Sheet" button on the Excel Price Feed toolbar. This will download the latest live data from Yahoo Finance into the spreadsheet:

Summary
We hope this tutorial has provided some useful guidance on using Excel Price Feed to build a live Excel stock screener.
Discover the power of Excel Price Feed with 80+ new Excel formulas for live, historic and fundamental data in your spreadsheet. Click the button below to request an Activation Code for your free 10 day trial: