Excel Company Income Summary 10-K Template
Introduction
A Form 10-K is a comprehensive annual financial report required by the US Securities and Exchange Commission. The report provides a wealth of information about the company's business, the risks it faces and the operating and financial results for the fiscal year.
A key section of the report is Item 8, the “Financial Statements and Supplementary Data†section which contains the company's audited financial statements.
This includes the income statement, balance sheet, statement of cash flows and statement of stockholders' equity.
We will create an income statement template in Excel using only Excel Price Feed formulas.
Getting Started
To get started, you need either a valid Excel Price Feed Trial or Subscription (if you have neither then you can start a free 10 day trial by pressing the big yellow button at the top of the page).
We will focus on Apple; their financial overview, from page 41 of their 2018 10-k form, can be seen below:
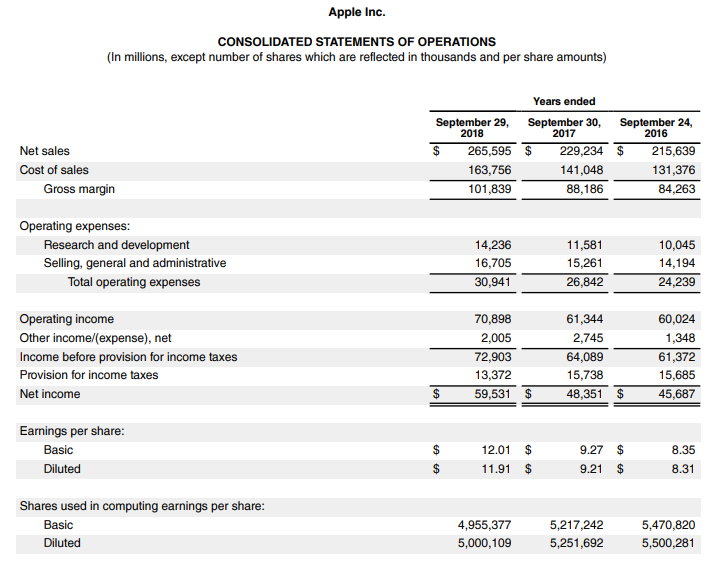
Excel Price Feed provides 100+ new Excel formulas which you can use in your own spreadsheet to retrieve live and historic market data. For this template we will use the formulas which retrieve annual company income data from Yahoo Finance.
Excel Price Feed Formulas
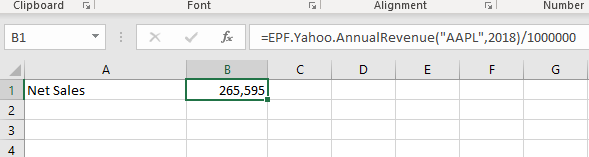
The Excel Price Feed formulas are very easy to use, they work exactly the same as normal Excel formulas. For example, "Net sales" (revenue) is the first row of the income summary, the formula to retrieve net sales for Apple for 2018 is:
=EPF.Yahoo.AnnualRevenue("AAPL",2018)
We can enter this formula into the spreadsheet and see that it populates the cell with 265,595 which is Apple's 2018 annual revenue (note we have divided the result by 1,000,000 so the figure is in number of millions).
Building and using the template
We can continue adding more Excel Price Feed formulas to build the template to show the same information as the 10-K form. For a complete list of all Excel Price Feed Yahoo Finance formulas please refer to Formula Reference: Yahoo Finance
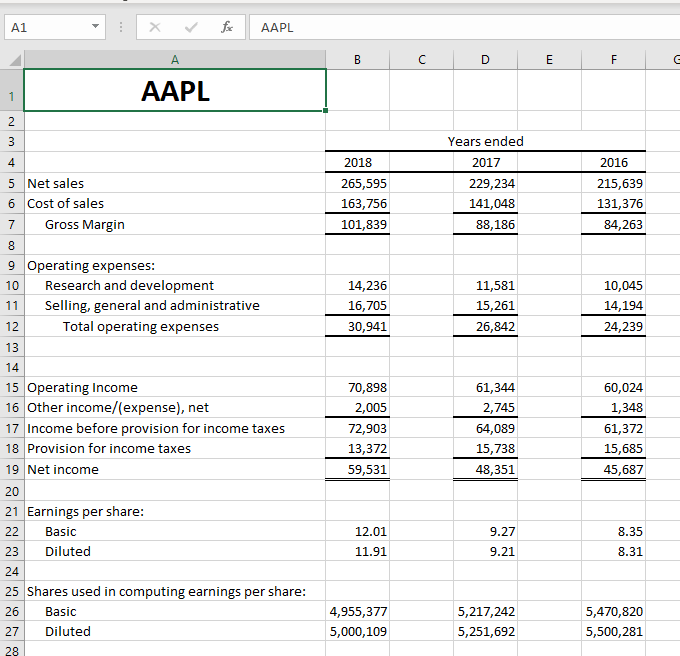
The template is very easy to use, it contains a bunch of data fields which all reference the stock ticker cell (A1). Type the ticker of the stock you wish to analyse and the data will be automatically refreshed.
Here is the completed template showing the income summary for Apple:
Bonus: Stock Comparison and Analysis in Excel
The great benefit of having a library of Excel Price Feed formulas is that it enables us to compare and analyse financial information very quickly and easily.
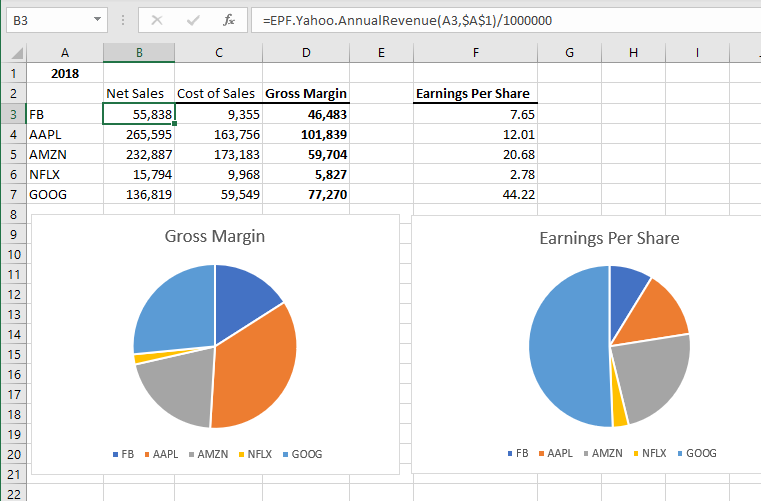
For example, if we want to compare the gross margin and earnings per share for the FAANG companies (Facebook, Apple, Amazon, Netflix and Alphabet’s Google) we can use the Excel Price Feed formulas to easily build a table like the one below.
We don't need to copy and paste the data from another source/website, it is available through simple Excel formulas.
We can then use Excel pie charts to visualise the data; here we can see that Apple has the highest gross margin, however Google has by far the highest Earnings Per Share:
Discover the power of Excel Price Feed with 100+ new Excel formulas for live, historic and fundamental data in your spreadsheet. Click the button below to request an Activation Code for your free 10 day trial: